Monitoring Basics... On the Cheap
I’m writing this to share how I am (and have) done monitoring of my Mastodon instances. If this is helpful, cool. If not, it’s all good.
I’m a cheap bastard, so all of the tools are free to use.
Availability Monitoring
Making sure that my site is up when I am not around watching it – in other words, making sure it’s available.
Better Uptime is free for hobby projects. Its free tier has free email alerts, 3-minute checks, 10 monitors and 5 status pages. More than enough to monitor a Mastodon instance.
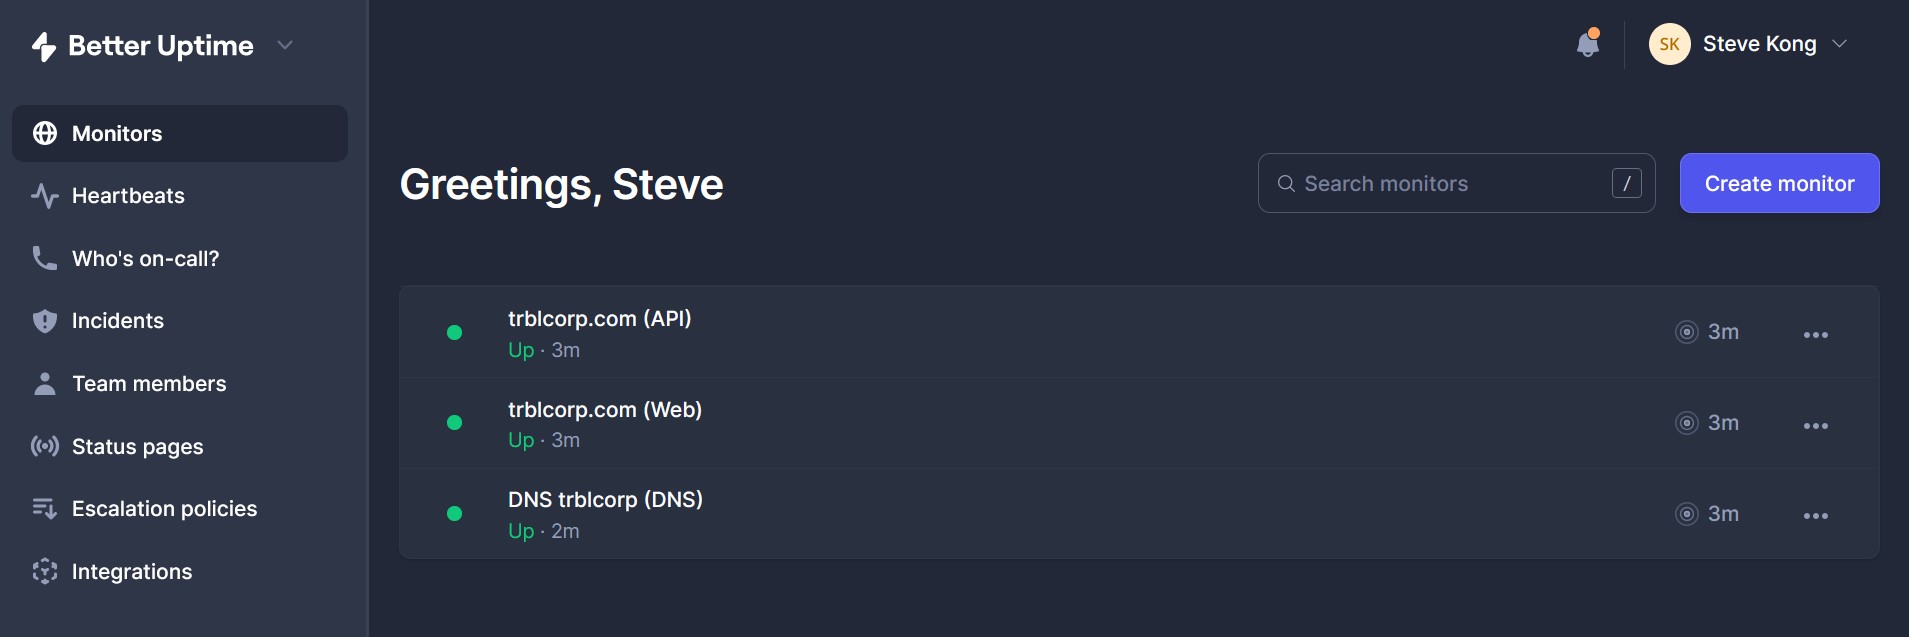
I created three basic checks:
- A check for the website itself (https://trouble.social). When creating this check, I made sure that in the “SSL verification” section of Advanced settings section, the SSL expiration check is set for some duration (it defaults to 14 days). That way my site will never be unavailable because of an expired SSL certificate – oh the public shame if this were ever to happen.
- A check to make sure that the Mastodon API is still running (https://trouble.social/api/v1/streaming/health) and to alert when a keyword is not found – the keyword being “OK”.
- A check that my domain is resolving using a DNS check – because when stuff breaks, it’s most likely DNS.
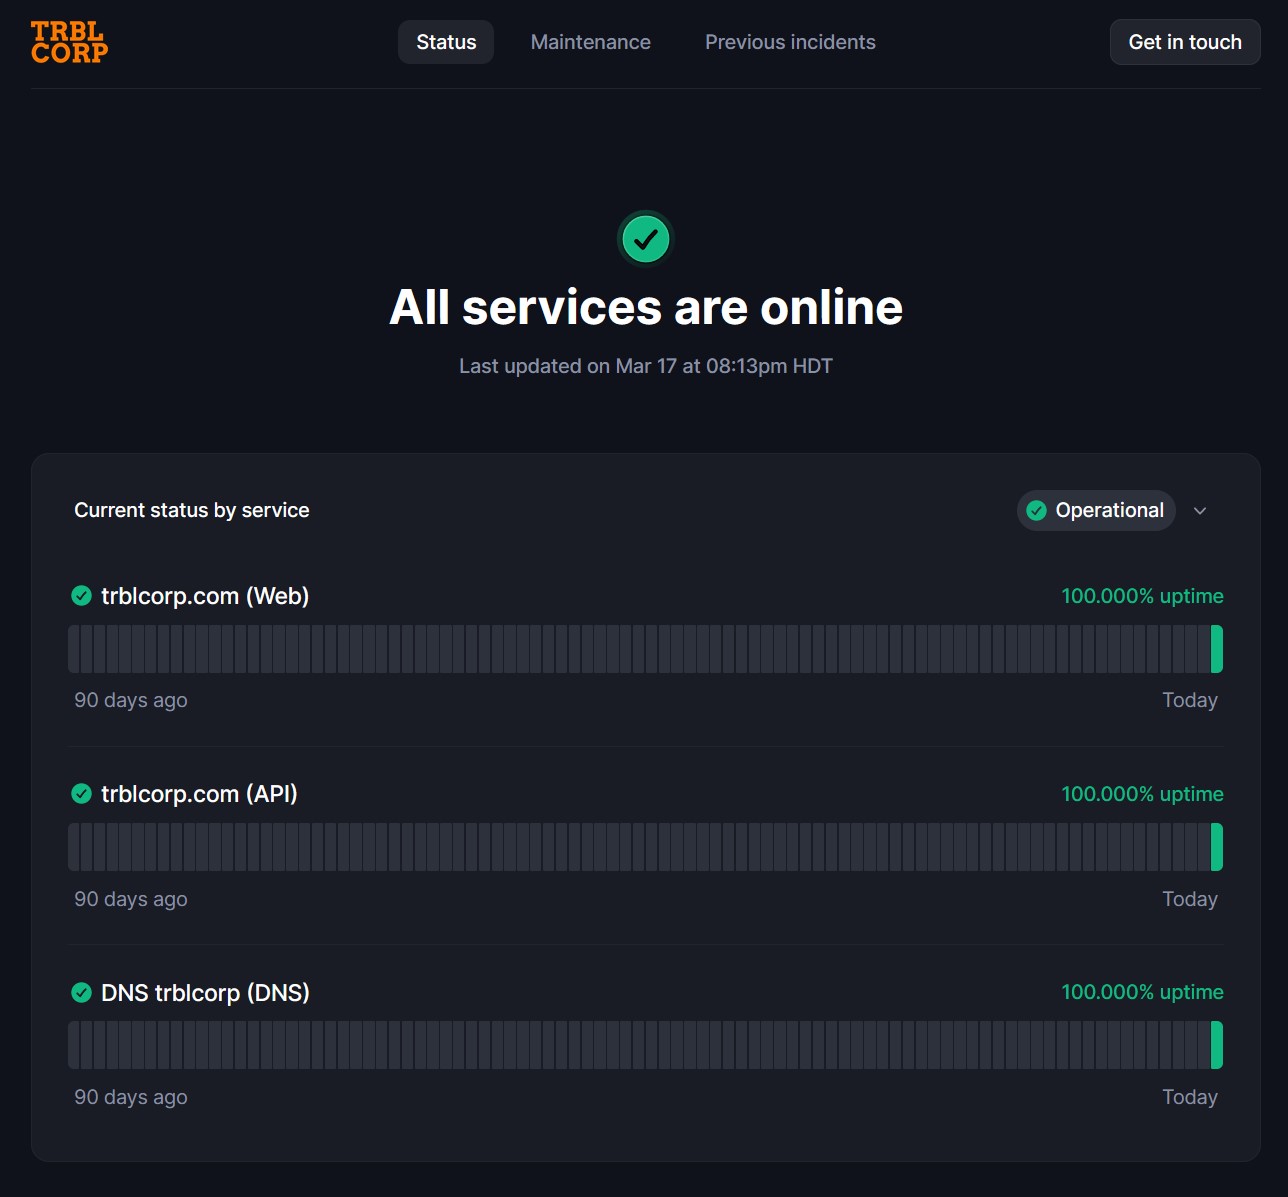
Once all checks were setup, I created a status page. Better Uptime provides a URL that I can link to, but for vanity, I used their custom domain option (https://status.trouble.social).
Systems Monitoring
Dead Man’s Switch
Dead man’s switch monitoring is great for making sure things are still running. I use it for systems monitoring via a scheduled job that pings https://healthchecks.io regularly. Healthchecks.io is free for hobbyists giving access to monitor 20 jobs. It also integrates with a slew of tools for alerting – Slack, Email, Webhooks, Discord, Microsoft Teams, Signal, Pushover, WhatsApp and more.
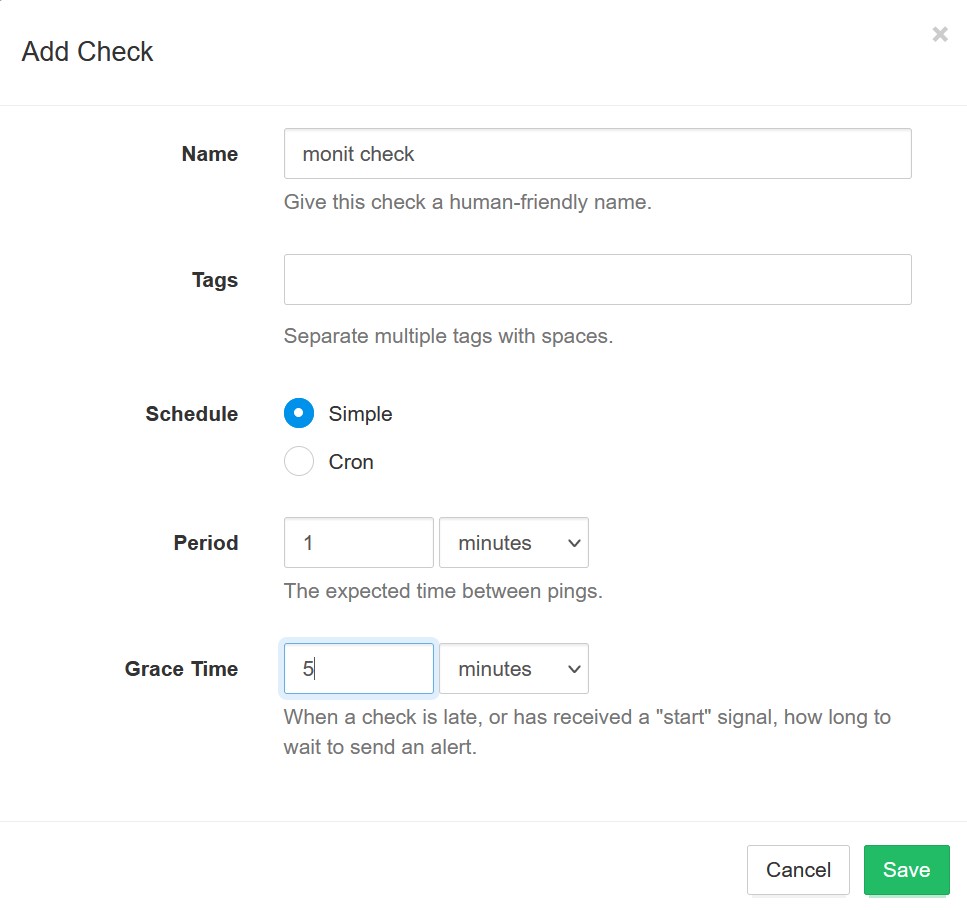
After signing up for healthchecks.io, I added a check. I set the check period to one minute (to match the monit check that I write about below) and then set the Grace Time to five minutes (so at most, I won’t know about my server being down for five minutes. This I hope cuts down on being pinged for random blips).

When I had added the check, I got something like the screenshot above. The part I am interested in is the UUID of the check – in the screenshot it is the part after https://hc-ping.com/ (so the part that starts with “9114” in the example).
monit
The quickest way to monitor a system is via monit. On Debian or Ubuntu, installing monit is as easy as:
sudo apt install monit
To have monit send alerts to me, I needed an SMTP server. I just used Gmail’s SMTP server since I don’t expect a bunch of emails coming out of monit (instructions here).
Here is the monit configuration file that I put into /etc/monit/conf-enabled/mookie.conf
set daemon 60

set httpd port 8081
  allow localhost
  allow 127.0.0.1

set alert MY@EMAIL-ADDRESS.TLD

set mailserver
  smtp.gmail.com
  port 465
  username GMAIL-USERNAME
  password GMAIL-APP-PASSWORD
  use ssl

check host healthchecks with address hc-ping.com
  if failed
    port 443
    protocol https
    request "/HEALTHCHECKS-UUID"
    for 2 times within 5 cycles
  then alert

check system $HOST
  if loadavg (5min) > 3 then alert
  if loadavg (15min) > 1 then alert
  if memory usage > 80% for 4 cycles then alert
  if swap usage > 33% for 4 cycles then alert
  # Test the user part of CPU usage
  if cpu usage (user) > 80% for 2 cycles then alert
  # Test the system part of CPU usage
  if cpu usage (system) > 20% for 2 cycles then alert
  # Test the i/o wait part of CPU usage
  if cpu usage (wait) > 80% for 2 cycles then alert
  # Test CPU usage including user, system and wait. Note that
  # multi-core systems can generate 100% per core
  # so total CPU usage can be more than 100%
  if cpu usage > 200% for 4 cycles then alert

check device rootfs with path /
    if SPACE usage > 80% then alert
This setup will check loadavg, memory, swap and cpu usage every minute – and alert based on the thresholds set. This conf will also ping the dead man’s switch every minute. If monit dies or my system goes down and doesn’t come back up, then healthchecks.io will ping me.
Once the conf file is in place, restart monit:
sudo systemctl restart monit
To see how my system is doing, I can run:
sudo monit status
Performance Monitoring
Get insights into how my system is running and seeing the performance trend over time – in other words stalking my server.
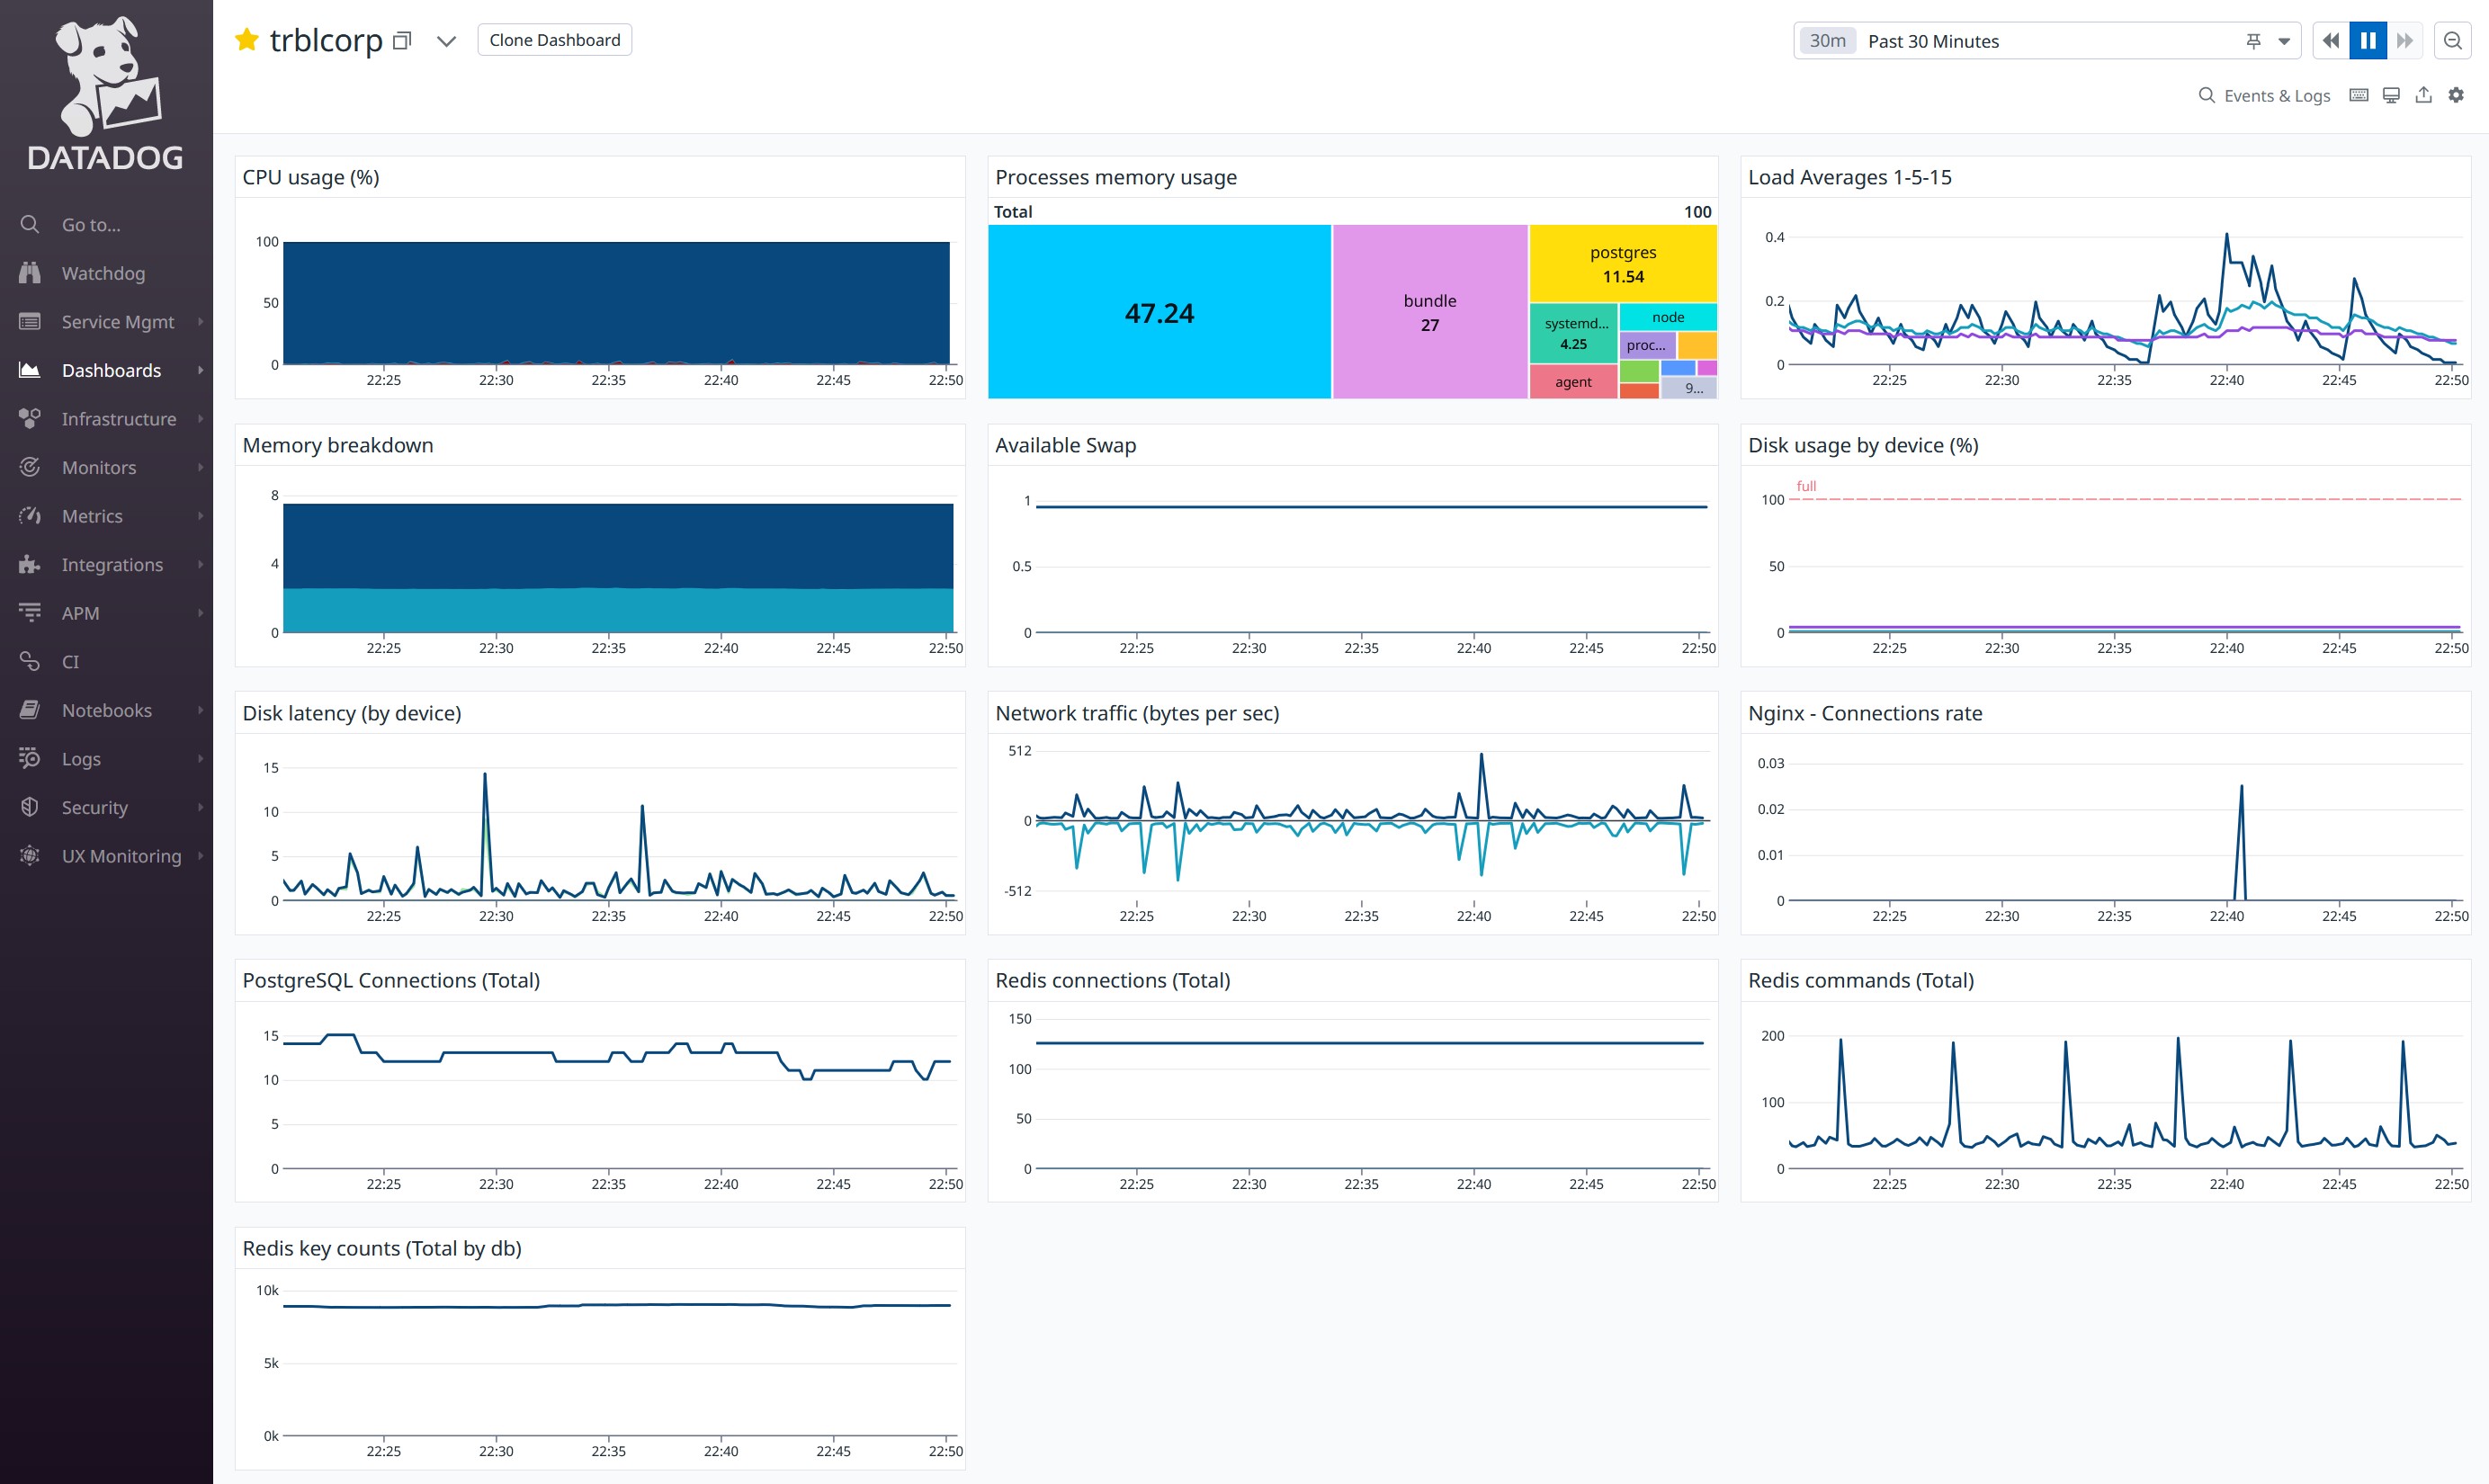
Datadog offers free events and metrics collection plus visualization for 5 hosts with one-day full resolution data retention.
I won’t go over the onboarding process for Datadog because they did a great job walking me through getting the Datadog Agent setup when I signed up for the service. There are a couple of integrations that I use for my Mastodon instances– nginx, PostgreSQL and Redis. They can be found in the integrations tab – and the services were detected after the Datadog agent was installed. The instructions are straightforward for adding each integration.
I don’t use Datadog for monitoring, I use it to keep an eye out on my system over time to make sure that nothing is running amok.
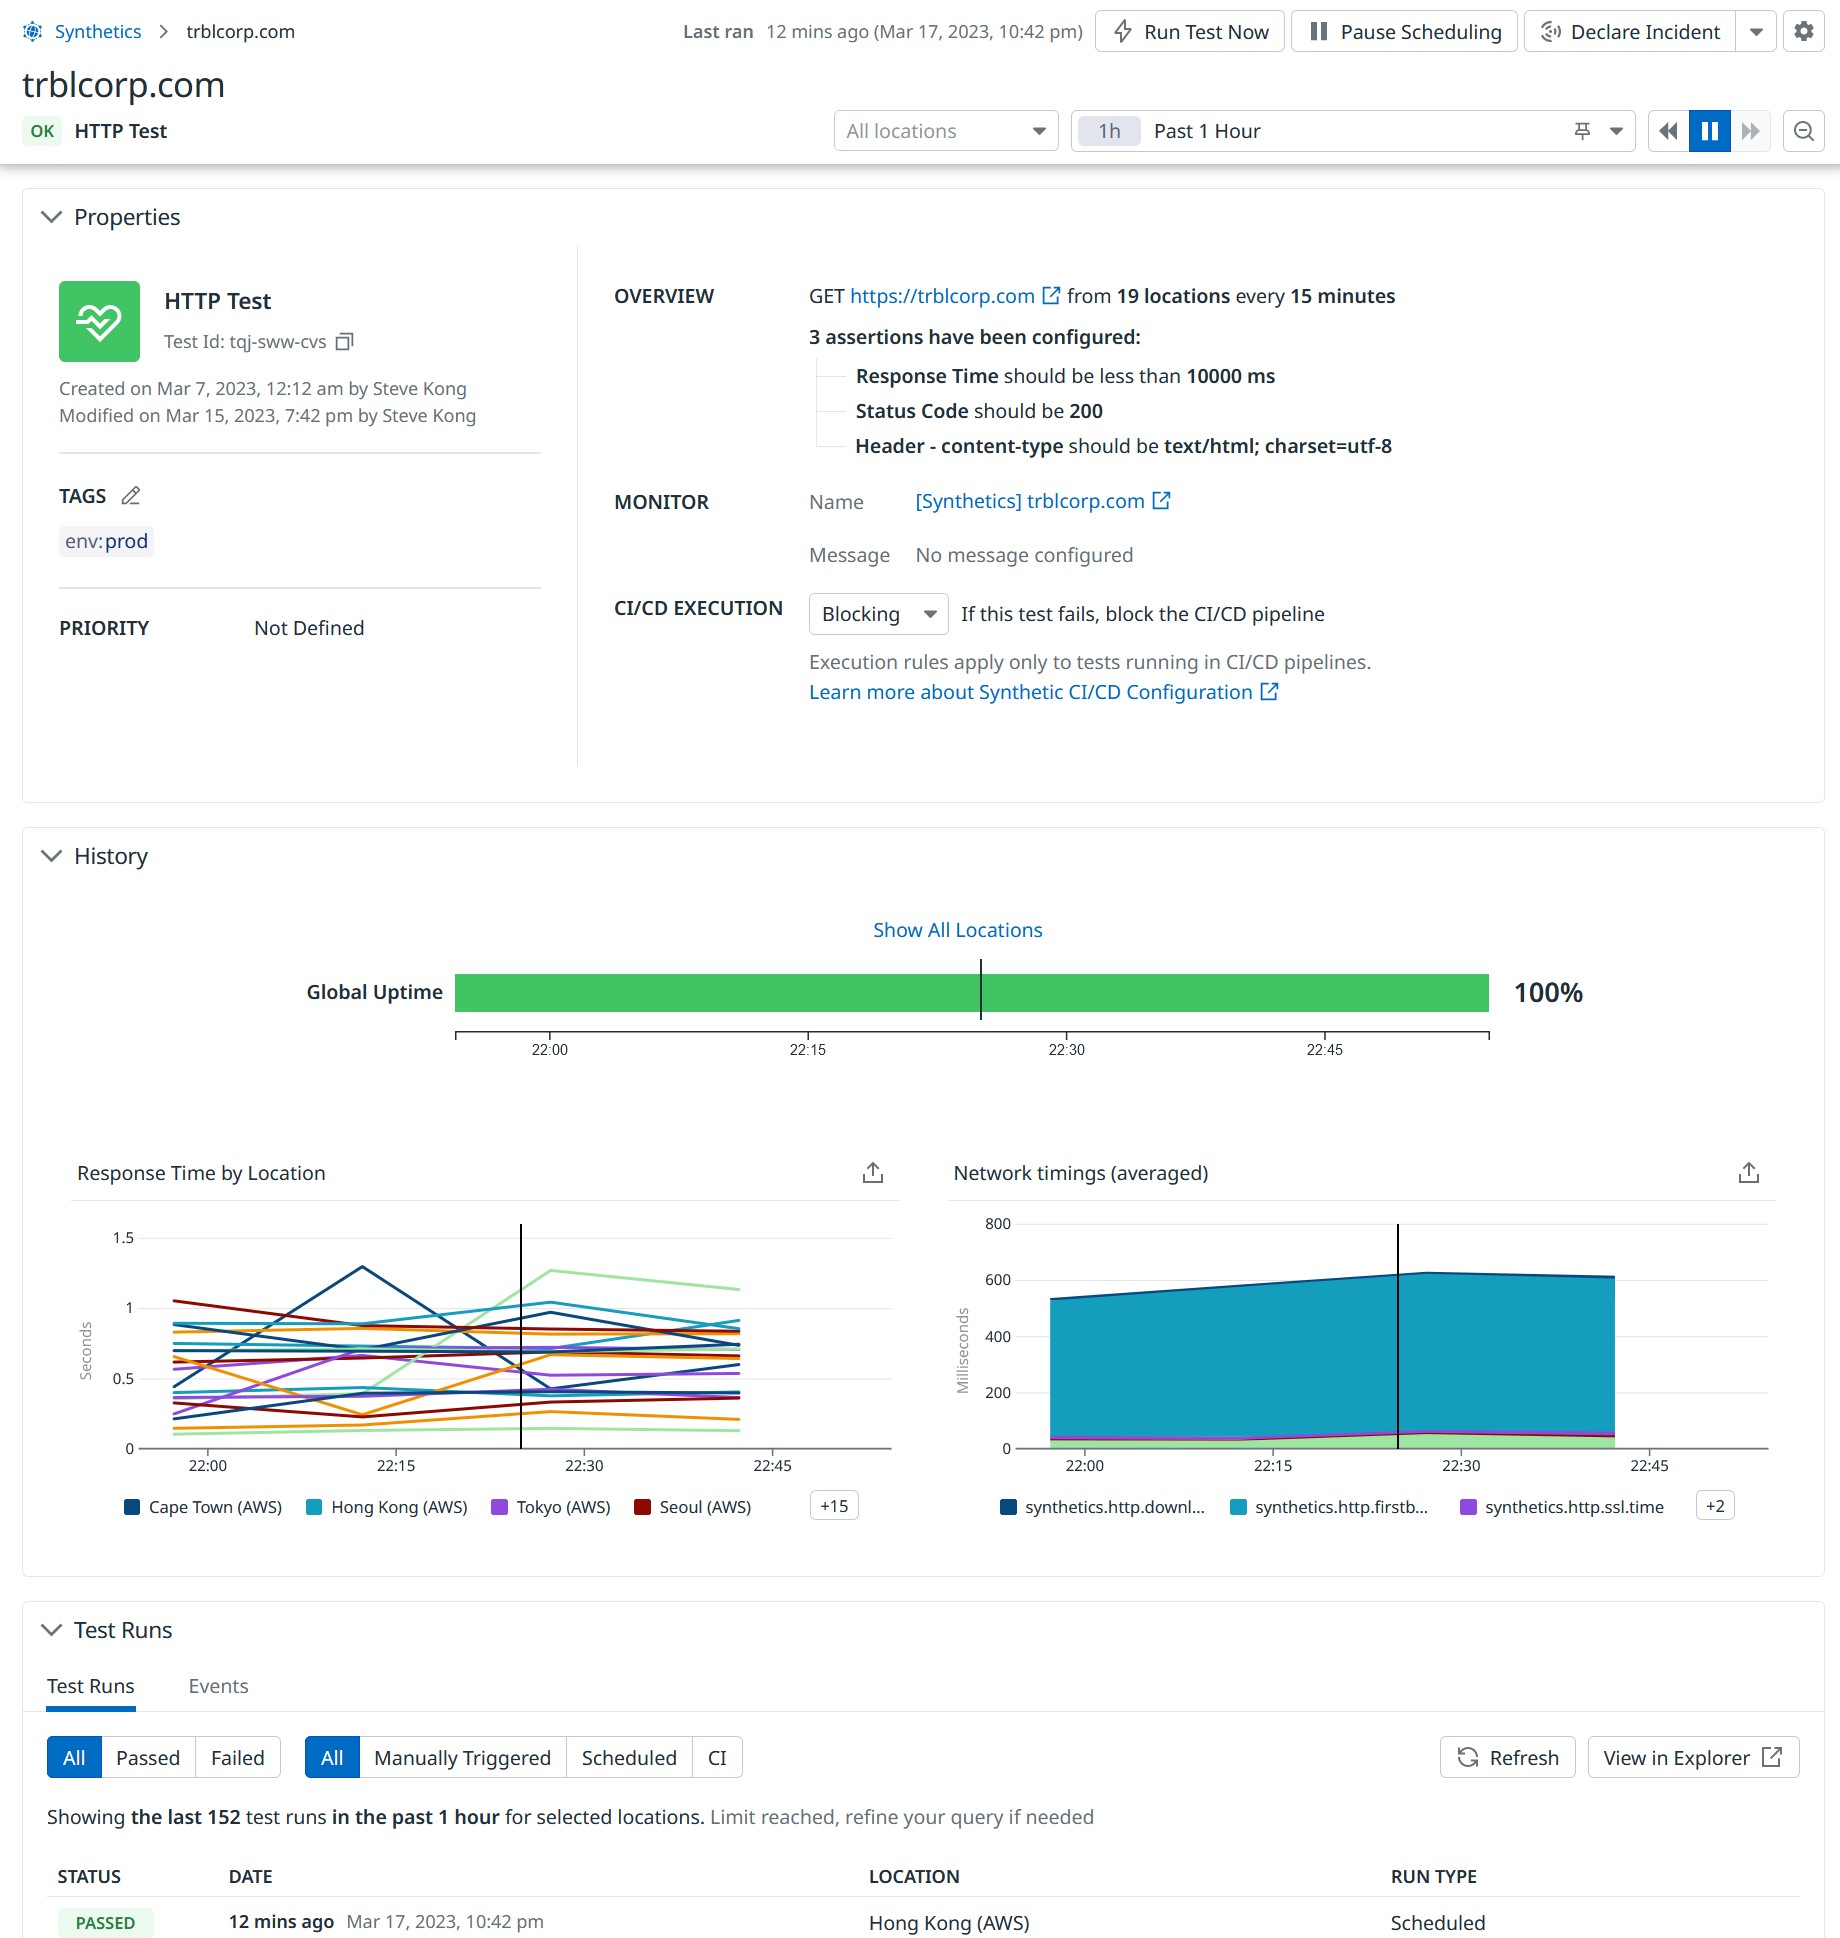
In the “UX Monitoring” tab there are the “Synthetic Tests”. These are great for getting a sense of how my instance is performing (network-wise) around the world. Datadog checks my site from 19 locations around the world at a time resolution that goes down to five minutes. These metrics are visualized into pretty graphs.
Conclusion
I had been running the above monitoring for a while. I made a change recently, I swapped in Uptime Kuma for Better Uptime. My Uptime Kuma server is hosted on a free VPS in the Oracle Cloud. I did this change for two reasons:
- I can send alerts to Discord
- I can have checks done on a minute resolution
The drawback to using Uptime Kuma is that the checks run from only one region in the world. Better Uptime checks from four regions in the world (North America, Europe, Asia and Australia).
So, this is how I am monitoring my server for free. Hopefully this was helpful and if you have any monitoring tools that you use that are not listed here, please share!